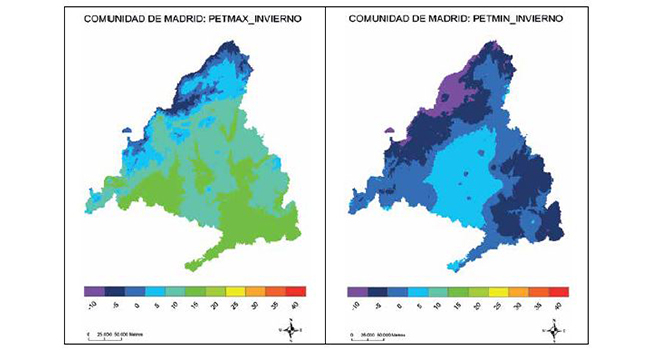
RESUMEN: El análisis espacial de los valores mensuales del índice PET, calculados para la Comunidad Autónoma de Madrid, se realiza mediante la elaboración de una cartografía bioclimática. Esta cartografía permite identificar los sectores donde hay un mayor riesgo de sufrir estrés térmico y, por el contrario, los sectores donde hay una mayor probabilidad de situaciones de confortabilidad termofisiológica. Por lo tanto, este tipo de cartografía se transforma en una herramienta imprescindible para comprender las condiciones térmicas y las situaciones de estrés a las que están expuestas las personas en determinadas regiones, y así poder planificar actuaciones dirigidas a paliar los efectos negativos de estas situaciones.
Los resultados muestran una característica fundamental de la distribución espacial de los valores calculados de PETmax y PETmin: una considerable heterogeneidad de estos valores, tanto máximos como mínimos, pese a la limitada extensión territorial del ámbito de estudio. Esta variabilidad espacial de las condiciones termofisiológicas se debe a un factor principal: las características y disposición del relieve que modifican los rasgos generales de las condiciones de confort térmico.
PALABRAS CLAVE: modelo bioclimático, modelización espacial, PET, Comunidad Autónoma de Madrid, confort.
ABSTRACT: The spatial analysis of the monthly values of the PET index, calculated for the Comunidad Autónoma de Madrid, is made by the development of a bioclimatic cartography. This mapping allows the identification of the sectors where there is a greater risk of thermal stress and, on the other hand, the sectors where there is a greater probability of situations of thermophysiological comfort. Therefore, this type of mapping becomes an essential tool to understand the thermal conditions and stress situations to which people are exposed in certain regions, and to be able to plan actions aimed at alleviating the negative effects of these situations
The results show a fundamental characteristic of the spatial distribution of the calculated values of PETmax and PETmin: a considerable heterogeneity of these values, both maximum and minimum, in a Community with territory of limited proportions. This spatial disparity of the thermophysiological conditions is due to a main factor: the topographic characteristics and the layout of the relief that modify the general features of the thermal comfort conditions.
KEYWORDS: bioclimatic model, spatial modeling, PET, Comunidad Autónoma de Madrid, confort.
AUTORES
ALFREDO MILLÁN LÓPEZ
Doctorando en Geografía Física, Departamento de Geografía, Universidad Autónoma de Madrid, Grupo Geoclima
Email: millan330@msn.com
VICTOR LALLANA LLORENTE
Profesor ayudante, Departamento de Geografía, Urbanismo y Ordenación del Territorio de la Universidad de Cantabria
E-mail:v.lallana.llorente@gmail.com

Be the first to comment